1 Introduction
Most of us walk unseeing through the world, unaware alike of its beauties, its wonders, and the strange and sometimes terrible intensity of the lives that are being lived about us.1
These web pages complement the data science chapter in the 4th Edition of BCT’s Bat Survey Guidelines(Coliins 2023), and hopefully encourage ecologists to make the most of their bat survey data. They also demonstrate literate programming with Quarto®2 and R Markdown3 which can vastly improve workflow4 (welcome to the world beyond Excel).
The term data science is used, as this covers data collection, management, processing, analysis, visualisation, interpretation, reporting and reproducibility. Statisticians would state this is what they have always done in statistics! There is no doubt the phenomenon of data science is growing, most major universities now offer a degree course in the subject and together with the increasing power of computer algorithms; data science is more than just a rebranding of statistics (Donoho 2017).
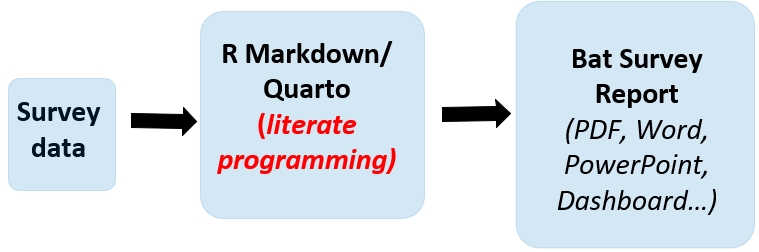
The data science is applied through literate programming outlined in Figure 1.1. This enables efficient reporting of bat data5 from a simple table, such as a count of bats, to the output and interpretation of machine learning in a fully formatted report; plus everything in-between, all accomplished through open source R6 (R Core Team 2023) and RStudio (Posit team 2022). The beauty of literate programming is reproducibility; an essential tenet of all scientific study, in the commercial and legal world it makes for defensible reporting. The One Click Reporting page has literate programming examples for a Word report and PowerPoint presentation.
Much is said about the digital skills gap 7; in a small way, these data science pages aim to improve digital skills by demonstrating modern data science methods8. For a balanced understanding of the link between digital skills and data science see the Royal Statistical Society article
You may ask what’s wrong with the spreadsheet for data science? On a practical level spreadsheets are hard to maintain, find errors in or see there was an error in the first place, they are poor at handling dates9 and difficult to share with others. For spreadsheet blunders listen to Tim Harford’s More or less on BBC sounds10; for a litany of mathematical mistakes, many involving spreadsheets, see Matt Parker’s book Humble Pi A comedy of Maths Errors (Parker 2019). On a positive note spreadsheets are handy and easy to use for a few lines of data.
To help ecologists on their data science journey, all the code making the graphs and analysis in these web pages is free to copy and use; just click on Show the code, copy to the clipboard 11, paste into the R environment and run. If new to R and RStudio see Section 1.3.
A Show the code is given below, the code produces Figure 1.2. The code copied to the clipboard is designed to run as a standalone chunk (or R script)12; the code loads the required R libraries and data.
Show the code
### Libraries Used
library(tidyverse) # Data Science packages - see https://www.tidyverse.org/
library(treemapify) # extension to ggplot for plotting treemaps -
# see https://cran.r-project.org/web/packages/treemapify/vignettes/introduction-to-treemapify.html
library(ggthemes) # for colour pallet "Tableau 10"

# Install devtools if not installed
# devtools is used to install the iBats package from GitHub
if (!require(devtools)) {
  install.packages("devtools")
}

# If iBats not installed load from Github
if (!require(iBats)) {
  devtools::install_github("Nattereri/iBats")
}
library(iBats)
###

# Add data and time information to the iBats statics bat survey data set using the iBats::date_time_info
statics_plus <- iBats::date_time_info(statics)

graph_data <- statics_plus %>%
  group_by(Species, Month) %>%
  tally()

ggplot(graph_data, aes(area = n, fill = Month, label = Species, subgroup = Month)) +
  scale_fill_tableau(palette = "Tableau 10") + #
  geom_treemap(colour = "white", size = 2, alpha = 0.9) +
  geom_treemap_subgroup_border(colour = "black", size = 5, alpha = 0.9) +
  geom_treemap_subgroup_text(place = "centre", grow = T, alpha = 0.9, colour = "grey20", min.size = 0) +
  geom_treemap_text(colour = "grey90", place = "topleft", fontface = "italic", reflow = T, min.size = 0, alpha = 0.9) +
  theme_bw() +
  theme(legend.position = "none") # No legend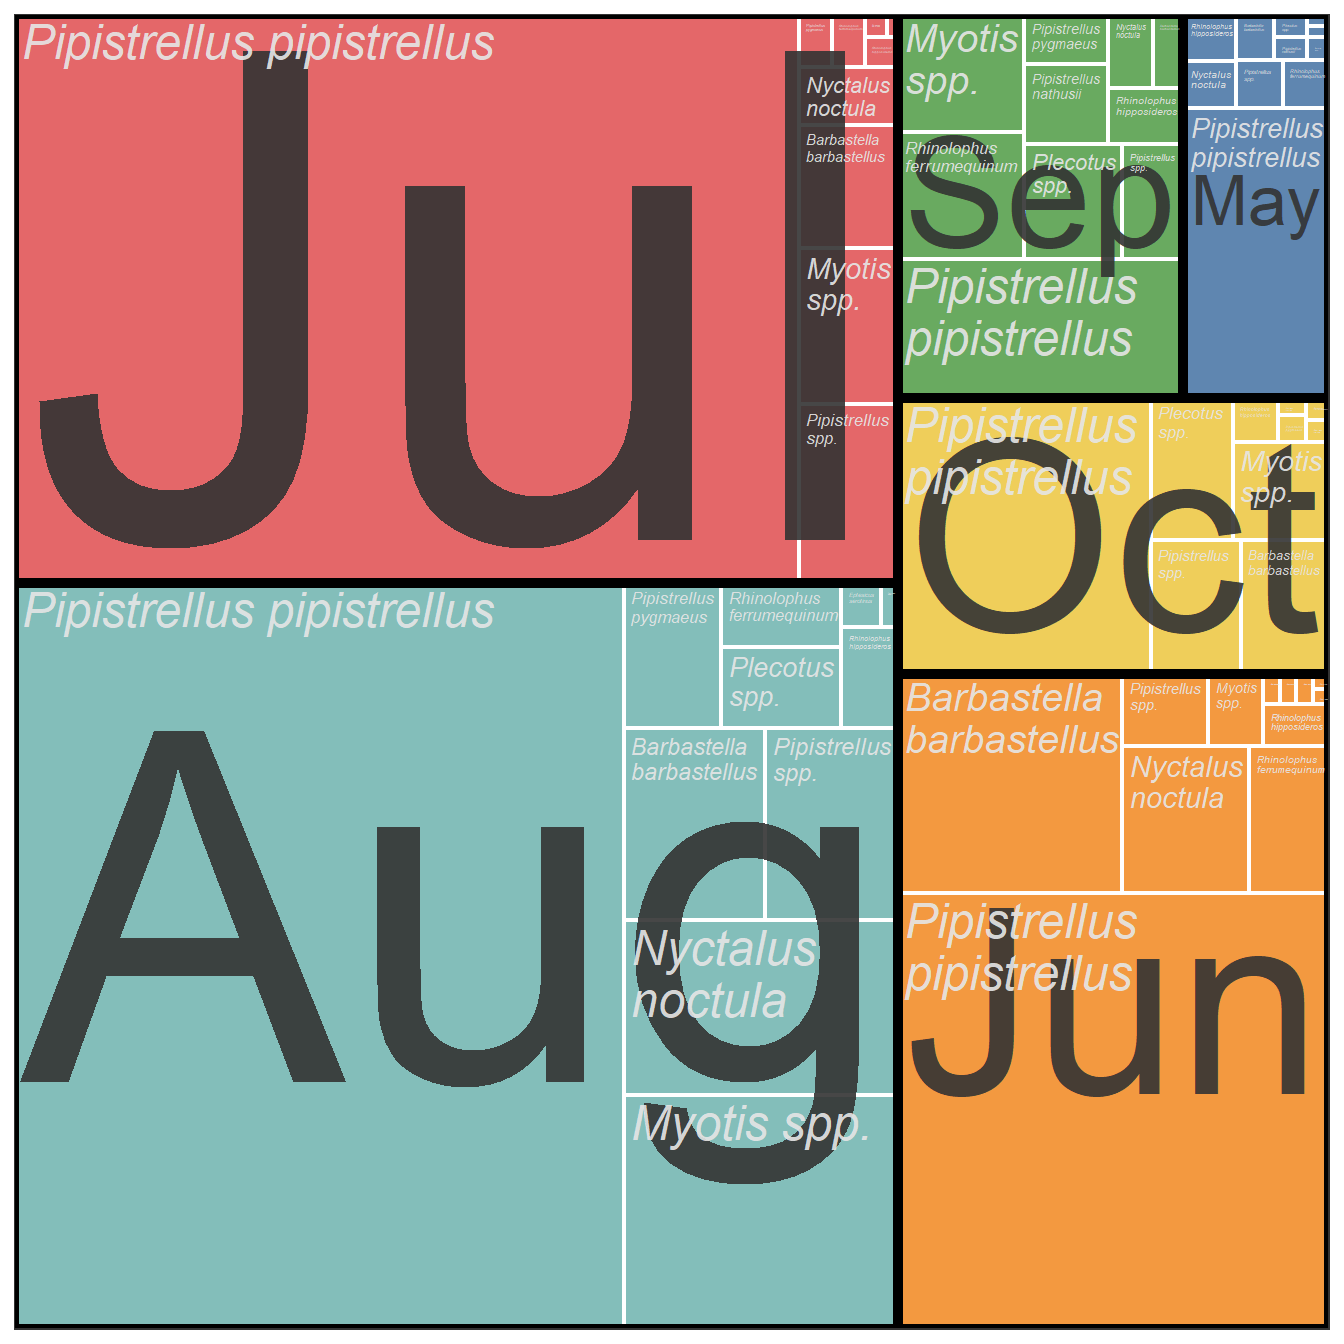
Rather than write code from scratch adapt working code to your own purposes.
Literate programming facilitates the use of coding languages other than R such as Python13, and Julia14. Computer languages can be mixed in the same literate programming document; for example with a chuck of R code doing the data manipulation and another chunk of Python code performing the machine learning. Coding languages applied to data science are developing rapidly in terms of their ability, speed of execution, and user friendliness15; literate programming provides the framework for ecologists to keep their data science skills moving forward.
1.1 BCT’s Bat Survey Guidelines
The first Bat Survey Guidelines, published in 2007 (Bat Conservation Trust 2007), didn’t incorporate any section on the data analysis of bat survey results. The second edition (Hundt 2012) and third edition (Coliins 2016) both had chapters outlining data analysis for bat surveys; with the third edition (Coliins 2016) introducing the concept of literate programming (Knuth 1984). The fourth edition (Coliins 2023) introduced tidy data (Wickham 2014), a key component of data science. The fourth edition refers to these web pages; where the data analysis and data science of bat surveys has been described in more detail.
The bat survey guidelines have kept up to date with bat survey methods, unfortunately they have not kept pace with advances in data science; this is due to the space required to describe the many aspects of data science that could be applied to bat survey results. It was also the majority view of bat survey guidelines editorial board, that expanding the data science sections went beyond what would be required by professional ecologists.
1.2 Evidence Led Reporting
Literate programming assists data science and reproducibility, promoting evidence led reporting and decision making. Reports are often produced for regulatory bodies, central government or local authorities, these organisations have mandatory strategies for the use of science, evidence and evaluation in there advice and actions, and the legality of their decisions (Natural England 2020).
1.3 Install R, RStudio and Packages
- Download and install the latest version of R https://cran.r-project.org/bin/windows/base/. Download the version for your operating system; R can be downloaded for Windows, Mac & Linux.
- It is recommended R is used through the RStudio IDE. Download and install the latest version of RStudio from their web page https://www.rstudio.com/products/rstudio/#Desktop. Download the free desktop version.
1.3.1 Install the iBats Package from GitHub
The iBats package contains example data and functions that help with the Data Science of bat survey results. To install this package use the code below in the RStudio Console; one line at a time. The package is installed from GitHub.
Show the code
install.packages("devtools")

devtools::install_github("Nattereri/iBats")
Acknowledgements
Free and Open Source Software (FOSS) constitutes 70-90% of any modern software solution16. R and RStudio are open source software that have made data science more open, intuitive, accessible, and collaborative. As a Public Good17 the value of FOSS is yet to be fully recognised. FOSS is provided by a large community, without whom these web pages would not be written; some of this community are acknowledged as individuals in the references section of the Resources page.
Rachel Carson, Silent Spring (1962)↩︎
Quarto® is an open-source scientific and technical publishing system: see https://quarto.org/.↩︎
R Markdown see https://rmarkdown.rstudio.com/.↩︎
For example literate programming eliminates the countless copy and paste of a traditional reporting workflow.↩︎
as exported from sound analysis software↩︎
Windows https://cran.r-project.org/bin/windows/base/ Mac Intel & ARM https://cran.r-project.org/bin/macosx/↩︎
The UK government has quantified the the UK Data Skills Gap see https://www.gov.uk/government/publications/quantifying-the-uk-data-skills-gap/quantifying-the-uk-data-skills-gap-full-report.↩︎
The data skills gap is relevant to professional bodies, such as the Chartered Institute of Ecology and Environmental Management (CIEEM) a leading institute for professional ecologists; their competency framework, which members are required to fulfill, makes no mention of statistics or data science.↩︎
Excel will convert a data entry into a date even if it is not, e.g. an entry of “1/1” or “1-1” would return “01-Jan”!↩︎
More or Less (Spreadsheet disasters) was released by the World Service on 11 Feb 2023 and is available for over a year.↩︎
Clip board icon is in the top right hand corner of the code window.↩︎
Many R script’s are required in applying literate programming to bat data science; these are best organised through Quarto or R Markdown documents where the R scripts form code chunks.↩︎
Julia has a language syntax similar to Python, runs fast, has a statistical library like R and linear programming skills similar to MATLAB.↩︎
https://www.linuxfoundation.org/blog/blog/a-summary-of-census-ii-open-source-software-application-libraries-the-world-depends-on↩︎
A commodity or service that is provided without profit to all members of a society, either by the government or by a private individual or organization.↩︎